
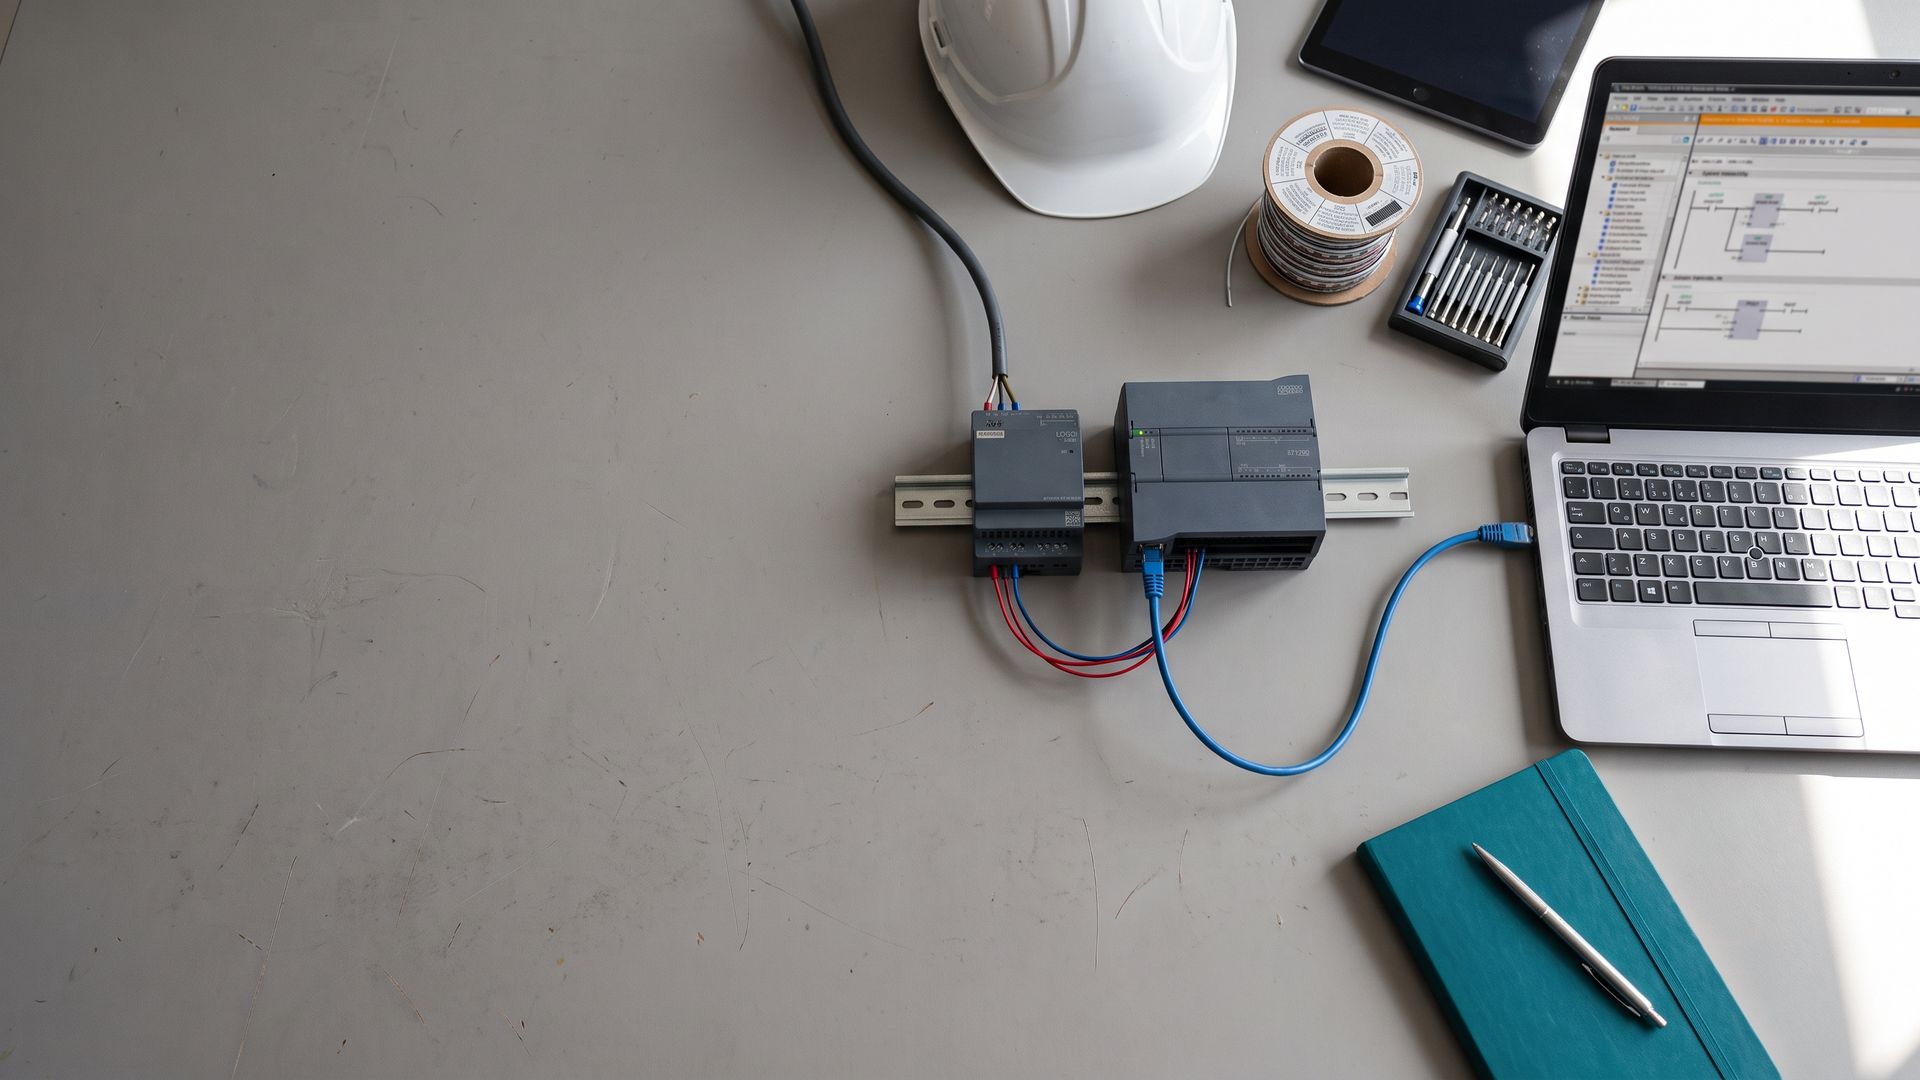
Energy and carbon data from the machines that use the energy.
We collect energy use at the machine and calculate carbon figures from it using the GHG Protocol method, so every number traces back to a meter.
WHAT NOW
More and more buyers are asking suppliers for the numbers.
Customers are asking
Larger customers now send suppliers questionnaires on energy use and carbon, and a supplier who can answer with real figures is easier to buy from.
When you need it?
You are adding a line or machine, an old controller is hard to support, or you want to see the whole plant on one screen.
Listed companies are on a timetable
Malaysia’s national sustainability reporting framework has applied to the largest listed companies since 2025, with more companies joining in 2026 and 2027. Requests for data tend to follow the supply chain down.
WHAT YOU RECEIVE
Figures you can hand to a customer.
Energy use, machine by machine
See which machines and lines use the most, by day, week and month.
Carbon figures, calculated the GHG Protocol way
The same method your larger customers use, so the numbers line up with their questions.
Energy and carbon for each unit you make
Kilowatt-hours per unit produced, such as per cubic metre of compressed air, and the carbon figure that follows from it.
A record behind every number
Each figure keeps its meter, its period and its emission factor, so you can show where it came from.
HOW IT WORKS
From the machine to the figure, in four steps.
01
Agree what to measure
We walk the plant with you and list the machines, lines and meters that matter for the figures your customers ask for.
02
Collect at the machine
We read the meters and controllers you already have, and add meters where there are none. Your machines keep running as they are.
03
Calculate the carbon
Energy use is turned into carbon figures with the GHG Protocol method, using published emission factors.
04
Show it and share it
A dashboard for your daily use, and tables you can download and hand to your customer or your own team.
For your engineers
What we measure, how we collect it and what comes out.
TECHNICAL SCOPE
Measurement
Energy use per machine, line or incoming feeder, from existing meters, with meters added where there are none.
Collection
Non-intrusive capture from existing machines, with no change to their internal code, stored in your own database.
Calculation
Energy converted to carbon with the GHG Protocol method and published emission factors. The factor, the period and the meter are kept with every figure.
Output
Web dashboards for daily use, and downloadable tables of energy and carbon figures by machine, line and month.
DELIVERED WORK
Compressed air energy monitoring and control.
We have delivered a compressed air energy project, monitoring and control together. Every compressor, air dryer and valve is controlled from one system and shown in one view, together with the electricity behind each cubic metre of air.
4
compressors, each with its own power meter
4 + 4
air dryers and valves, controlled and shown beside the compressors
kWh/m³
electricity per cubic metre of air, shown as now, this month and this year
For each compressor the screens show current, voltage, power, power factor, energy used and peak demand. They also show air flow, pressure and dew point, with trends and alarms. Efficiency is tracked against a baseline recorded before the project started, so the improvement is visible on the screen. A carbon figure comes from the same data: the energy for each unit produced, with the GHG Protocol method and a published emission factor.
RELATED
Where this fits.
Sectors we have delivered in
Energy monitoring is one of nine sectors we have delivered in.
OT software and IIoT
The software and web apps that connect your machines and put their data to work.
Industry 4.0 readiness (SIRI and COSIRI)
A benchmark of where your factory stands today, with a step-by-step plan.
Tell us what your
customers are asking for.
Send us the questionnaire or the request you received. We will tell you which numbers your plant can give you, and how we would collect them.