Nine meters, a Siemens SIMATIC S7-1200 and a SIMATIC IOT2050 at a Malaysian manufacturing plant, with a dashboard staff open from the office.
A TNB bill gives one electricity figure for the whole factory. Some customers now ask for more: how many kWh, on which machines, in which month, and what that means in carbon terms. Dreamaze built a monitoring panel that answers those questions with measured data.
The Scope 2 calculation itself is one multiplication: kWh × grid emission factor. Getting the kWh right is where the engineering work is. The panel reads nine energy meters, stores every reading on site and turns them into daily, shift and monthly reports.
What We Delivered
Metering on the machines that matter. Nine multifunction meters measure the electricity used by individual machines, not only the factory incomer.
kWh by machine, shift and month. The dashboard shows live readings, history and trends for each meter.
A Scope 2 figure with the factor on record. Emissions are worked out with the Energy Commission's grid emission factor. Each factor carries a start date and a source.
Reports on demand. Daily, shift and monthly reports can be produced from the dashboard and sent to the customer who asked.
Office access and remote support. Staff open the dashboard from a normal browser on the office network. Dreamaze engineers support the panel remotely over an encrypted VPN.
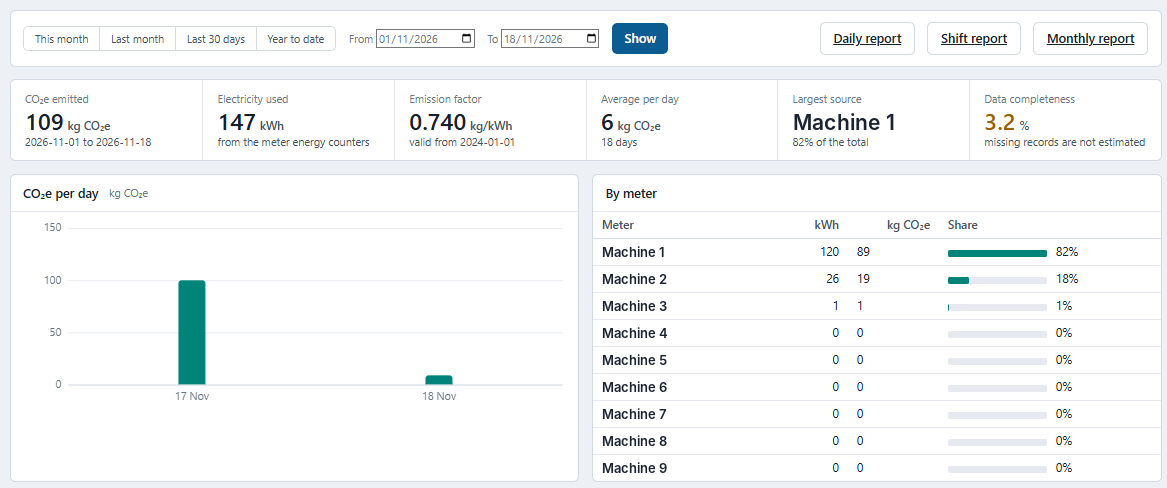
Figure 1. The Carbon tab: CO₂e emitted, electricity used, emission factor, data completeness, CO₂e per day and the split by machine, with daily, shift and monthly report buttons. Machine names are replaced. The system had only just gone live, so data completeness reads 3.2% for 1 to 18 November; missing records are not estimated.
How the carbon figure is worked out
Scope 2 (kg CO₂e) = energy used (kWh) × grid emission factor (kg CO₂e/kWh)
Illustration only: 1,000 kWh × 0.740 kg CO₂e/kWh = 740 kg CO₂e.
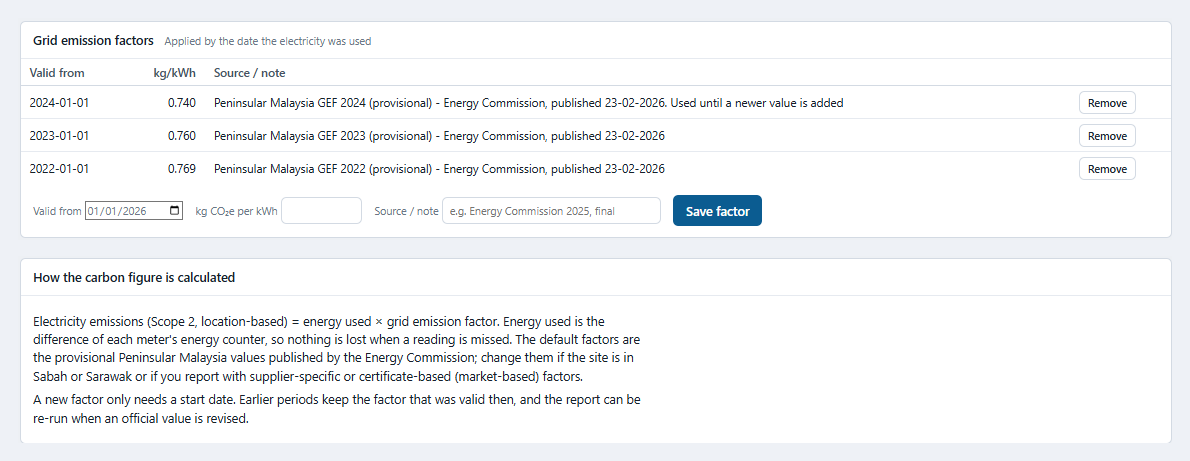
The latest published factor for Peninsular Malaysia (2024, provisional, Energy Commission, February 2026) is 0.740.
Three design choices decide whether the figure can be trusted:
Energy comes from each meter's energy counter, not from adding up power readings. If a reading is missed, the kWh is still in the next one.
Missing records are not estimated. The report shows how complete the data is, so the reader knows how much of the period was actually measured.
Every factor has a start date and a source. When a factor is revised, earlier periods keep the factor that applied then, and the report can be re-run.
Figure 2. Each grid emission factor is listed with its start date and source, and the screen states how the carbon figure is calculated.
What Is in the Panel
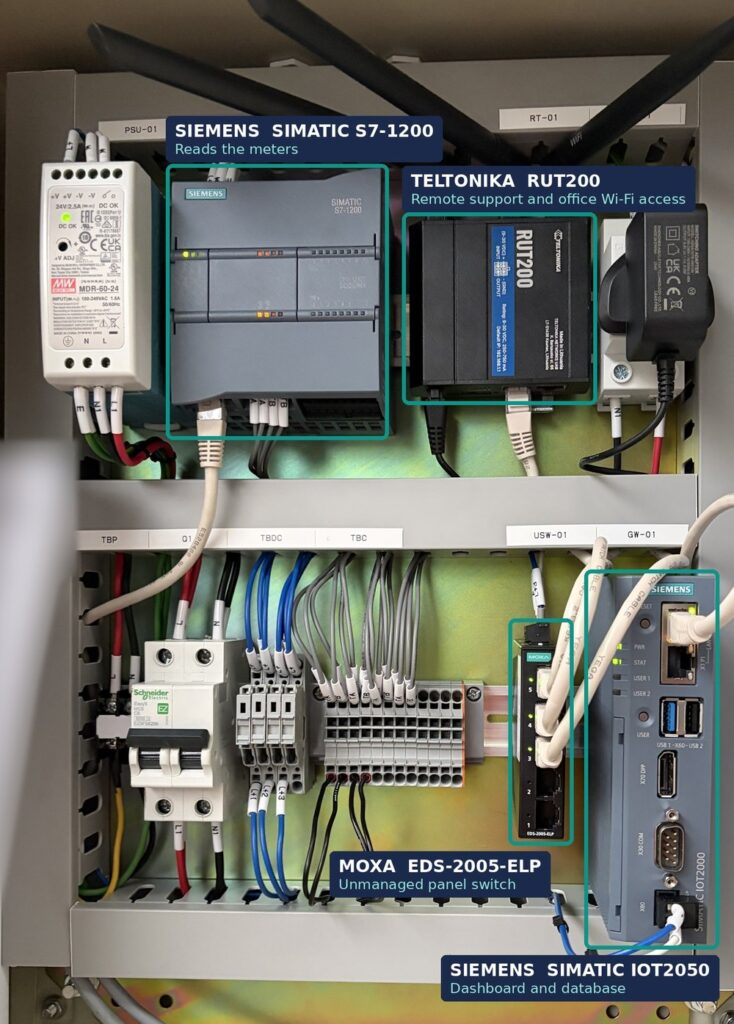
One wall-mounted panel holds the controller, the gateway, the router, the switch and the power supply. Each device carries a tag label, shown below as it appears on the panel.
Figure 3. The monitoring panel: Siemens SIMATIC S7-1200 (controller), Teltonika RUT200 (router), Moxa EDS-2005-ELP (switch) and Siemens SIMATIC IOT2050 (gateway).
PLC-01
Siemens SIMATIC S7-1200 - Reads the nine energy meters and holds their latest values for the gateway.
GW-01
Siemens SIMATIC IOT2050 - Runs the dashboard and the database on site. Produces the daily, shift and monthly reports.
RT-01
Teltonika RUT200 router - Joins the plant's Wi-Fi so the dashboard reaches the office network without new cabling. Carries the encrypted VPN used for remote support.
USW-01
Moxa EDS-2005-ELP - Five-port unmanaged Ethernet switch. The S7-1200, the IOT2050 and the RUT200 all connect through it, on one wired network. It needs no configuration.
PSU-01
Mean Well MDR-60-24 - 24 V DC supply for the panel's devices.
Nine Mikro multifunction meters - Measure the electricity used by each monitored machine.
What we supply, and what we do not.
We supply measurement data. We do not verify or certify emissions. Reporting and assurance stay with the company and its auditors.
Why it matters
See where the kWh goes.A bill shows one total. Machine-level data shows which machine, which shift and which month, and how much of the bill the metered machines account for.
Answer customer data requests with a measured record.Listed companies are moving to ISSB-based climate reporting under Malaysia's National Sustainability Reporting Framework, and their suppliers are starting to receive data requests. A measured record is easier to hand over than an estimate.
Know how much of the period was measured.Missing readings are shown as missing, with a data completeness figure, instead of being filled in.
Keep the factor history.Each emission factor keeps its start date and source, so last year's report can be re-run when an official value is revised.
Control your own cost.The same meters show which machines use the most electricity, which helps decisions on shifts, idle running and maintenance.
Why Choose Dreamaze?
Dreamaze Sdn Bhd is a Malaysian OT system integrator, delivering control systems for plants and infrastructure since 2018. We are a Siemens Second Tier Distributor (Factory Automation), and our engineers are trained in Teltonika industrial networking.
One team from meter to dashboard. The panel design, the Siemens controller programme, the network and the dashboard software come from the same engineers.
Hardware comes with a service scope. We set out what is supported and what is outside the scope before the panel is built.
Remote support without a site visit for every question. Remote access runs over an encrypted VPN, and we also attend the plant when it is needed.
Started from the need, not the product. We begin with what your customer has asked for and size the number of meters to that.
Does Your Customer Ask for Energy or Carbon Data?
Tell us their request. We will let you know if machine-level metering fits your plant!
Send CARBON on WhatsApp and we will arrange a free 20-minute discussion, by phone or at your factory.